IPTraf-NG#
Because top doesn't show us networking statistics for a given process, we'll install and use iptraf-ng for this.
Remember from our hardware basics that systems have a NIC (or multiple) - Network Interface Card - that allows it to connect to a network and communicate with our systems. In Linux, this NIC is referred to as an "interface" when using iptraf-ng, because it's an interface to a network.
I have two interfaces on my system: lo and eth0. The lo interface is known as the loop back interface, and it allows me to connect to network services that are being run on my local system (as opposed to another, remote system.)
The eth0 interface is the first Ethernet interface installed into my system, allowing me to connect to and talk over an Ethernet network (the most common type in the world.)
We'll use my eth0 to explore some statistics, below.
Getting started#
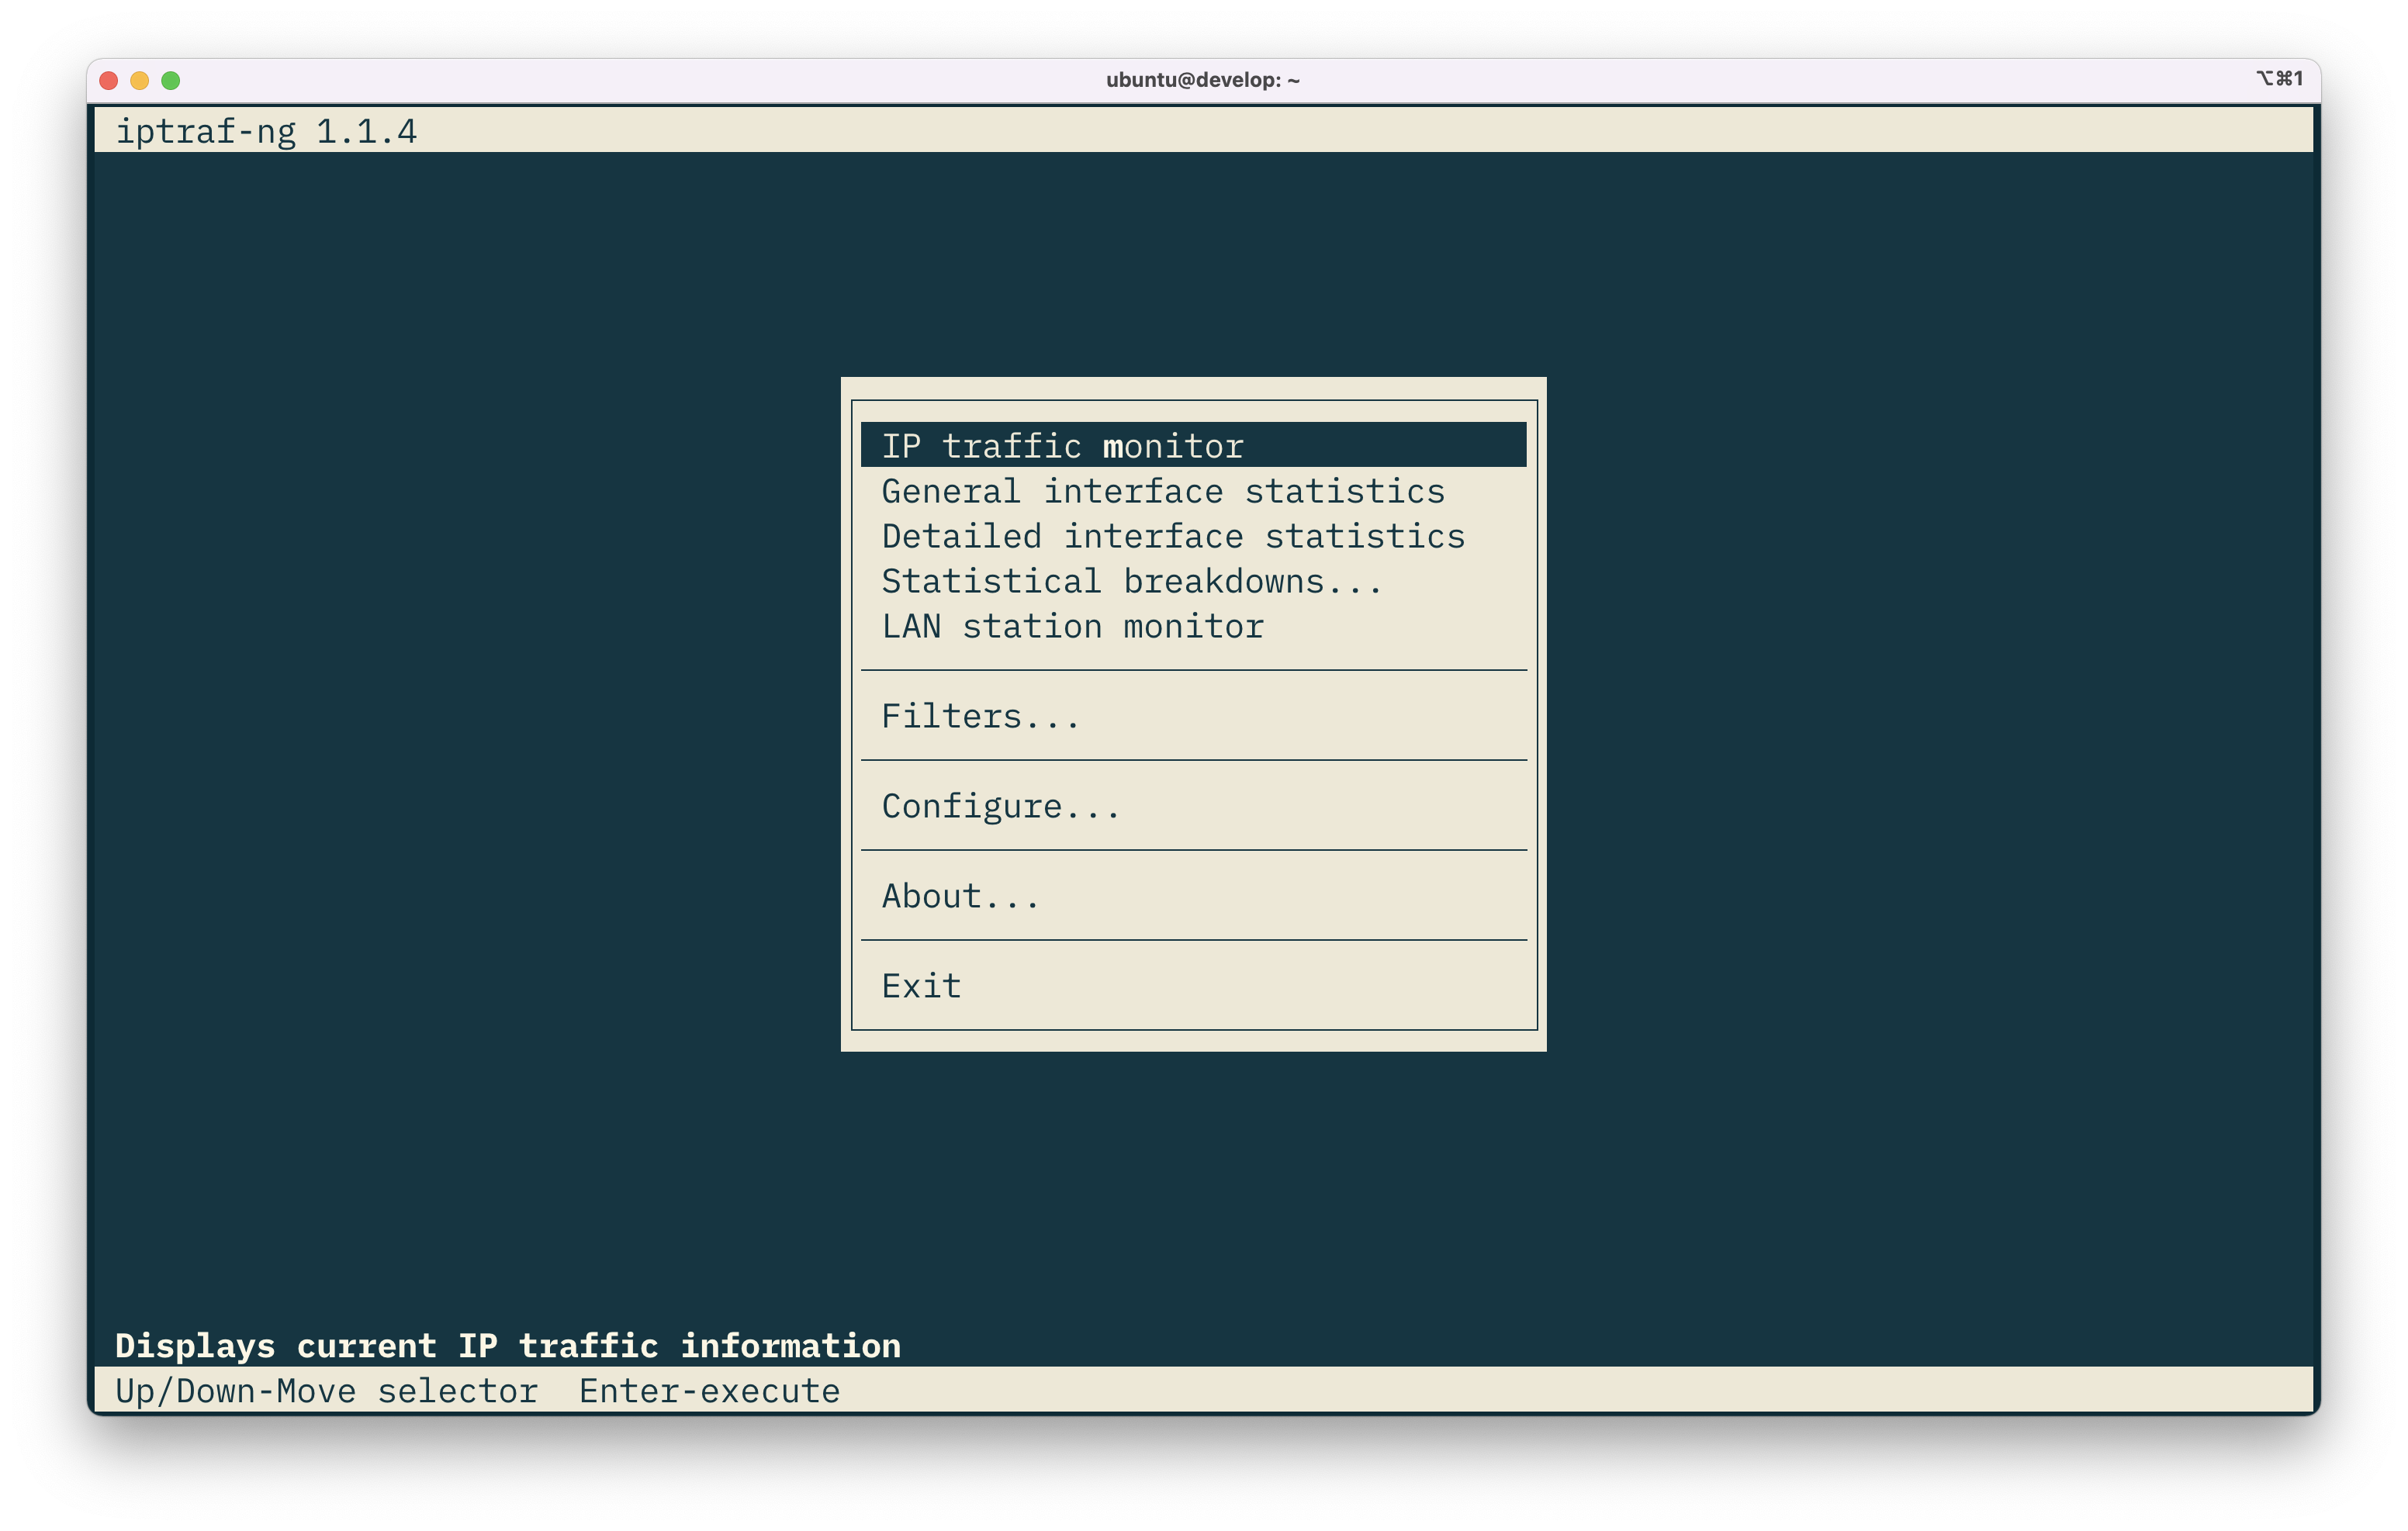
Installing iptraf is very simple: sudo apt install iptraf. Now run the tool. I get this: sudo iptraf-ng
sudo iptraf-ng
Plenty of options to explore here. We'll explore only a few of them, starting with "General interface statistics":
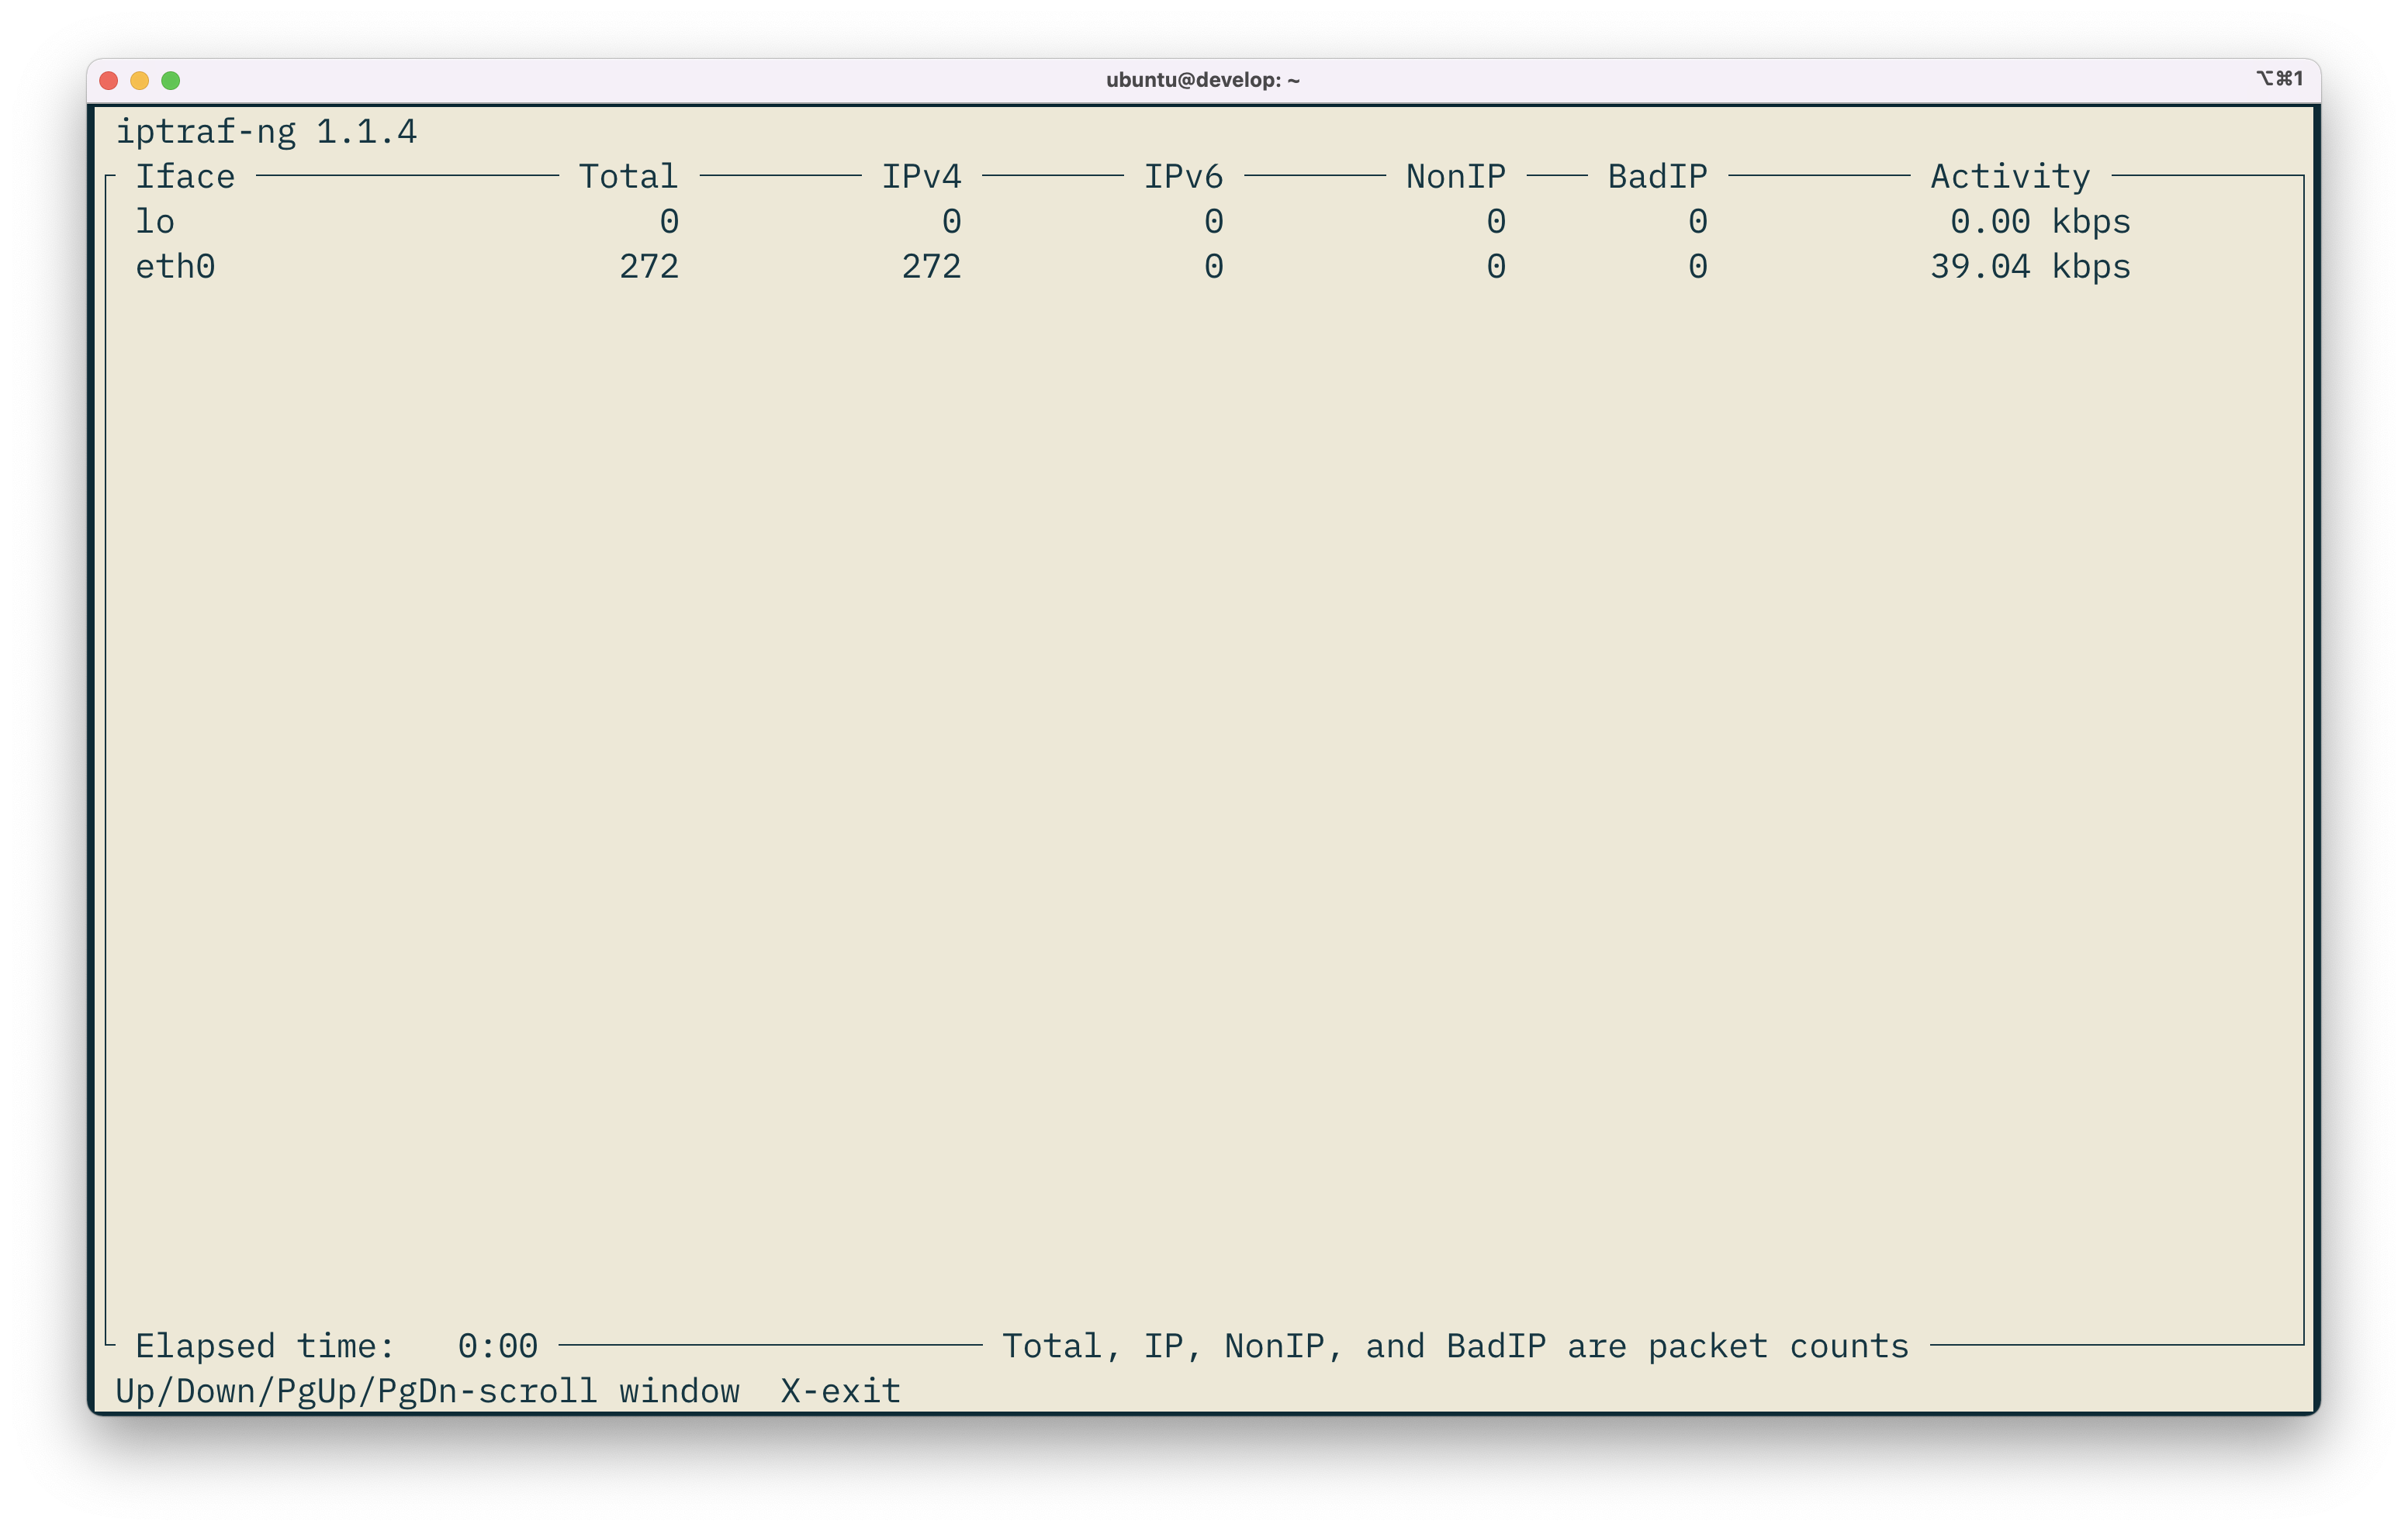
I see a few columns here: Iface, Total, IPv4, IPv6, NonIP, BadIP, and Activity.
The Iface is the interface or NIC that we're measuring. We're seeing packets and live bandwidth usage for the interface.
The Total, IPv4, IPv6, NonIP, and BadIP counters are packet counts, as it says at the bottom of the window. These are the literal number of packets going through the interface right now.
Activity is the live bandwidth being used across that interface.
Let's hit X and then check out the "IP traffic monitor" page (I selected the eth0 interface in the window that pops up):
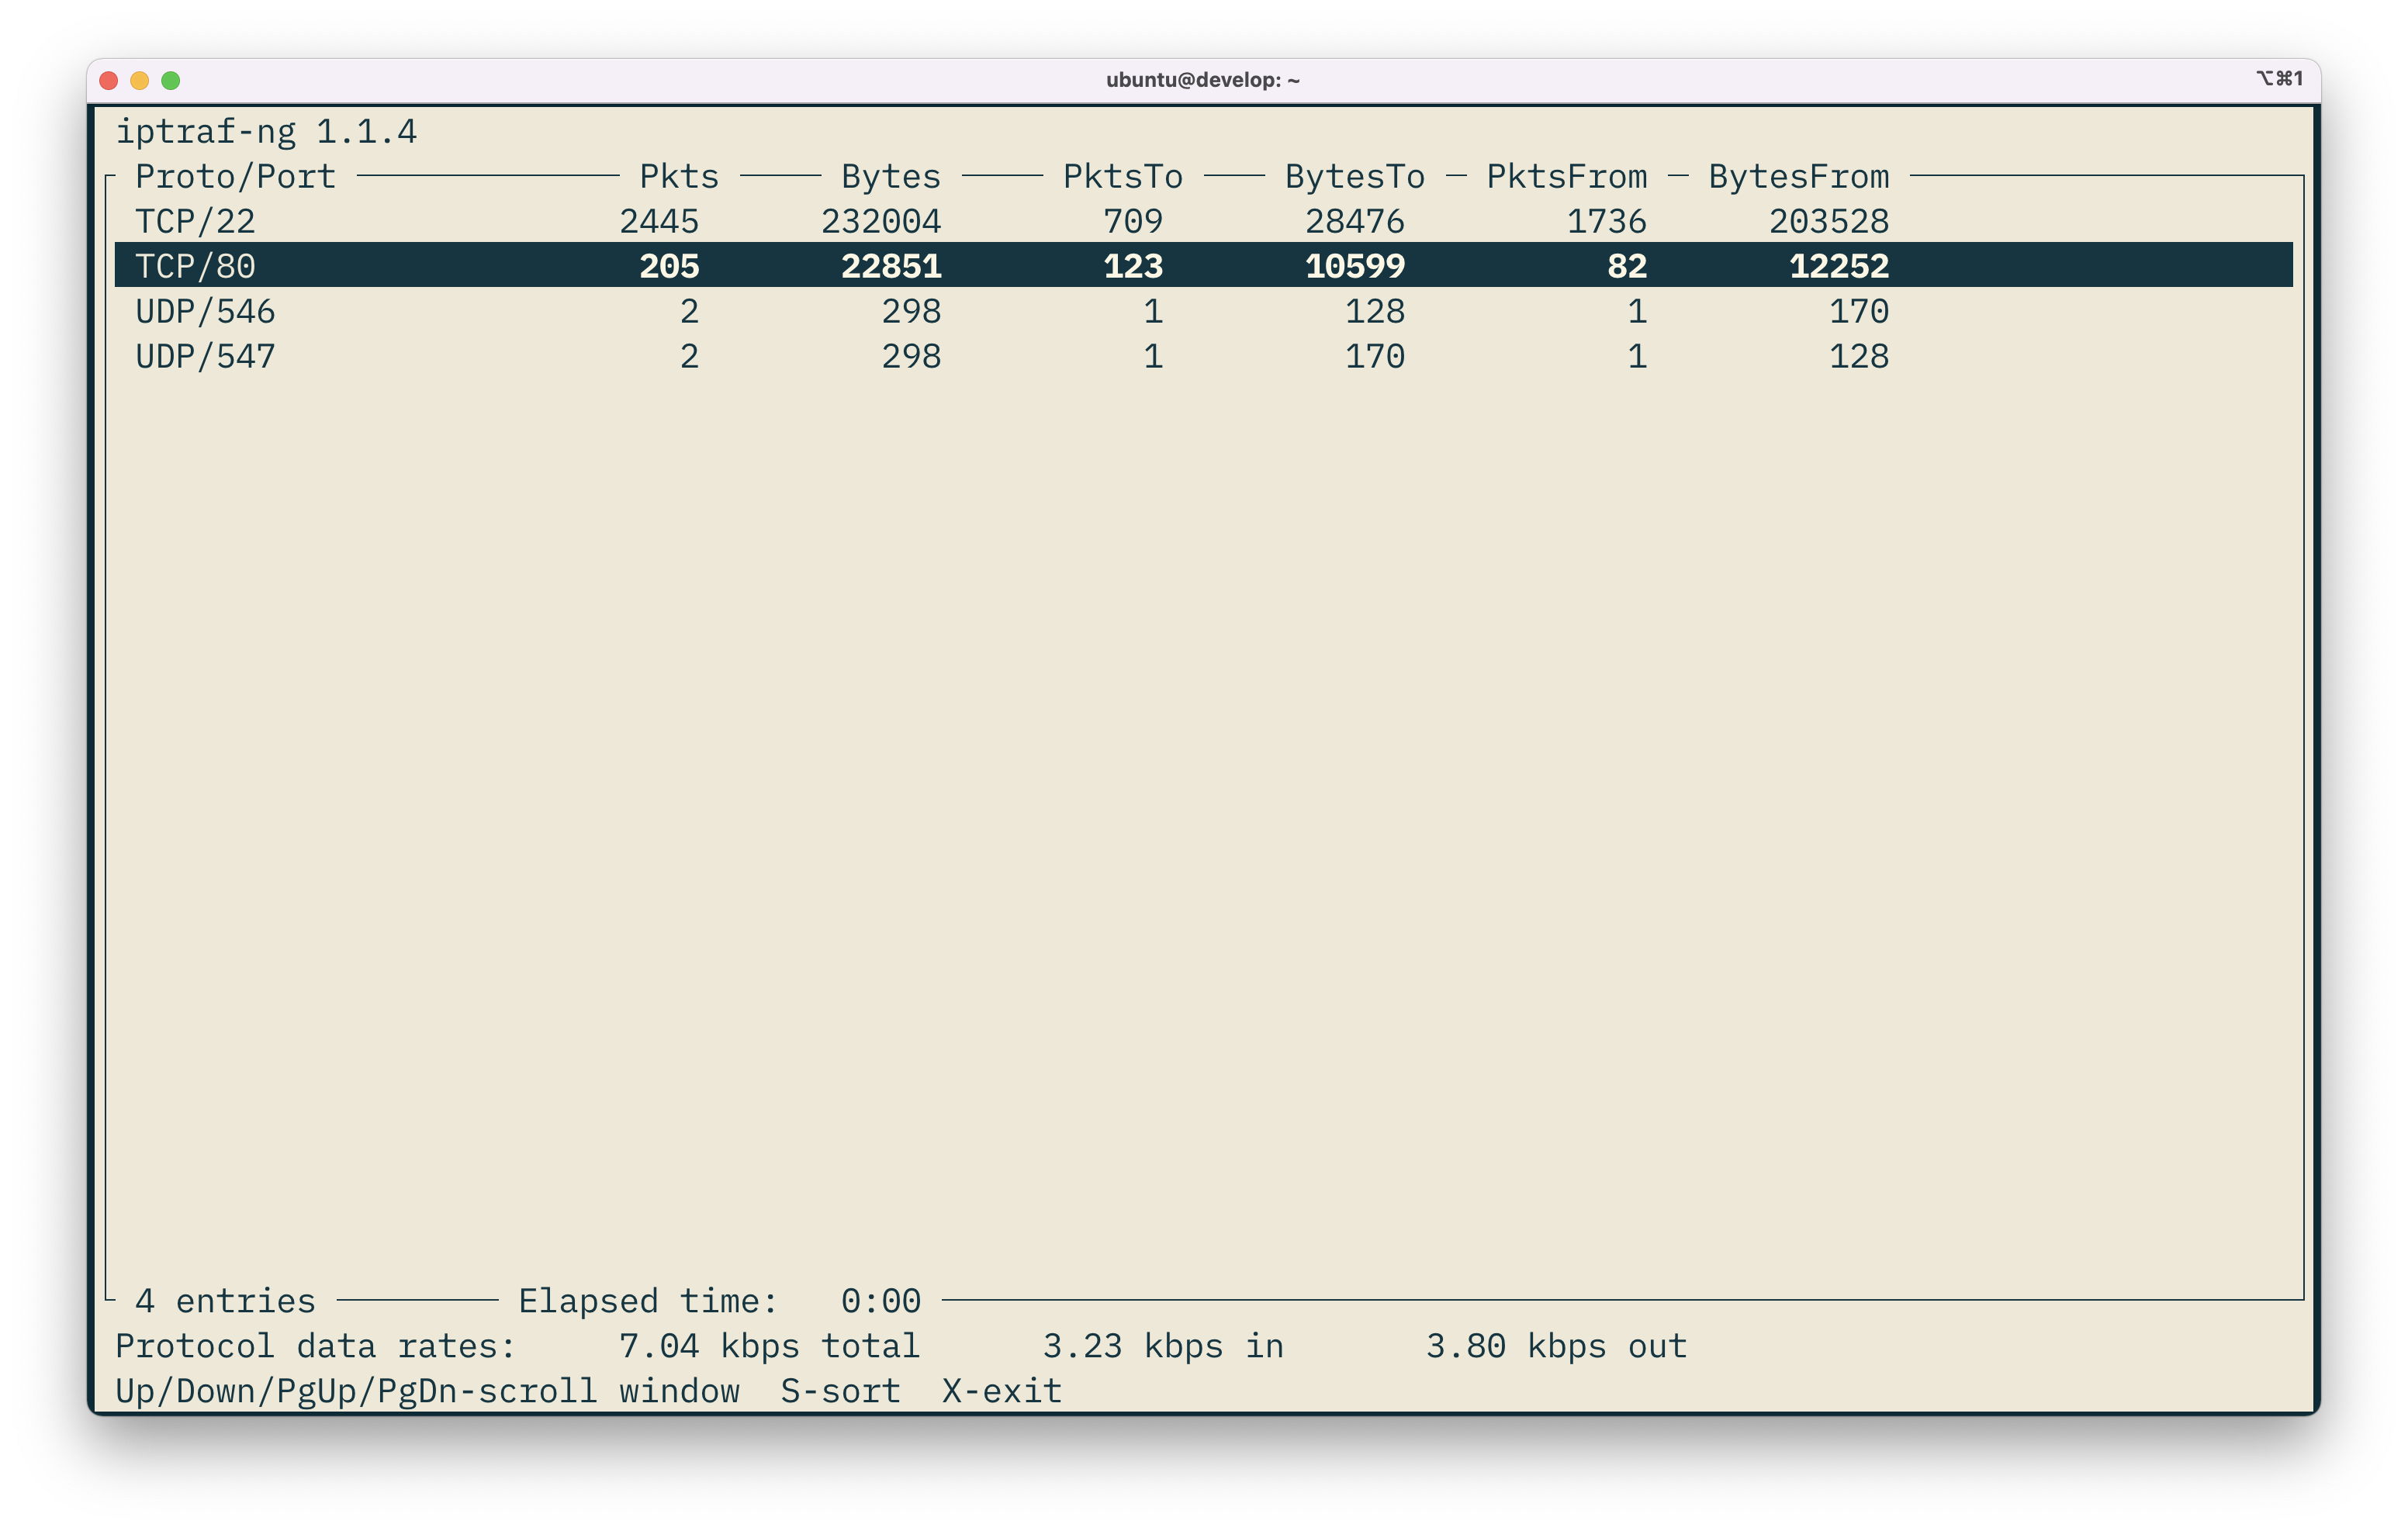
This is super interesting too, because instead of just having a general set of aggregated statistics for a specific interface, we can now see the statistics on a per-port level. We can see that TCP/22 (SSH) has used 2,445 packets during its connection with me and my laptop. We can see the bytes that have been transmitted in either direction, to and from the remote system. This is powerful information that helps you diagnose issues like network bandwidth saturation or even finding a malicious actor on your system.
Explore the rest of the iptraf-ng tool and see what else it can tell you about the network activity on your local system.
Connections per process#
Just one thing to keep in mind: everything you saw above was the network statistics for a given network interface, even down to the protocol and port. But what about the process? What if you have a TCP port open on your system but you don't know what process it relates to? This is especially important if you don't expect the port to be open.
Let's install nethogs and list the processes on our system that can using the network interfaces:
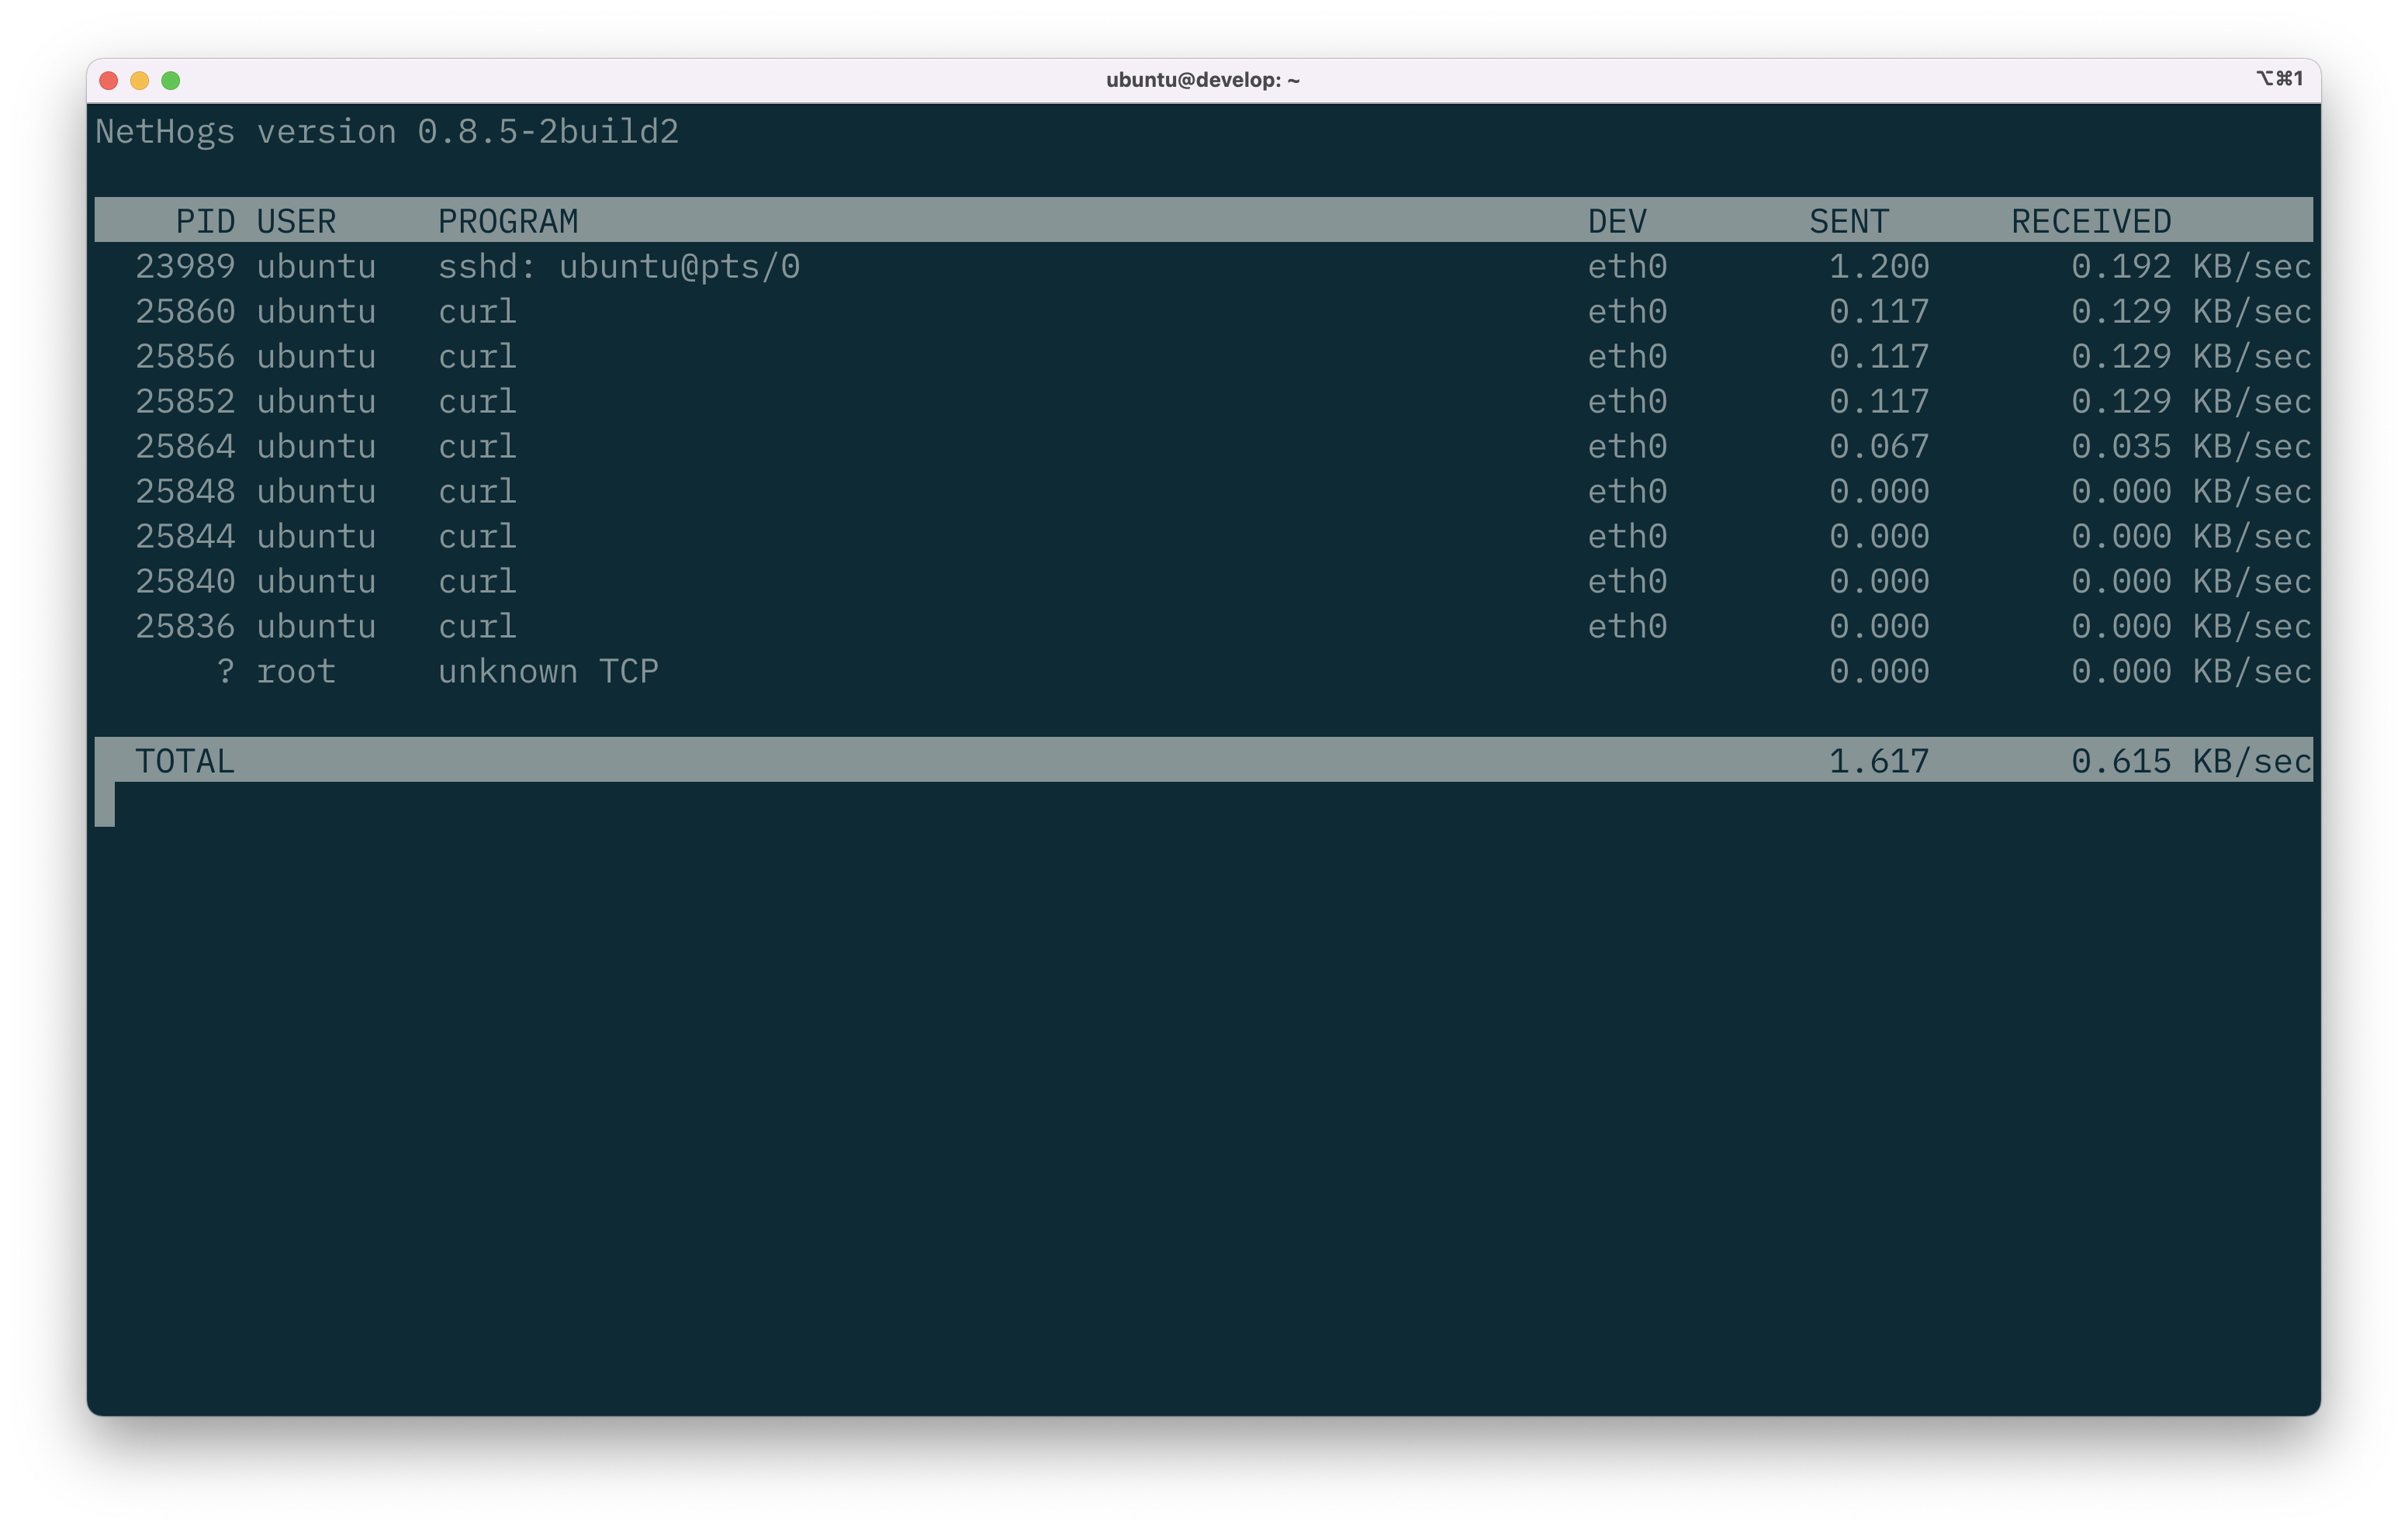
Now we can see an extra piece of information: the command or process using the connection. In this case we can see ssh is being used on eth0, so that would explain the TCP/22 usage. We can see several curl commands too. I know this is me simulating traffic in the background, but if I hadn't done this I would be concerned!
Using lsof#
One final, built-in command is lsof. This is a powerful command, but it's also very useful to quickly finding out what's open on your system.
What the command does is lists (ls) all open files (of) on the entire system. Are network connections files? Technically everything on a Linux (or Unix[-like]) system is a file.
If we just run it, we get flooded with results. We can use lsof to only show us certain things, however. For example, we can use sudo lsof -i TCP:22 to show us if anything is listening on TCP port 22 or connect to that port.
We can also use sudo lsof -i 4 to only list IPv4 connections:
1 2 3 4 5 6 7 8 | |
And IP6 connections: sudo lsof -i 6
1 2 3 4 | |
We can even us lsof to find things using a specific port range: sudo lsof -i TCP:1-1024 -P
Note
Note the use of -P to show numerical service port instead of names, i.e. 22 instead of ssh.
1 2 3 4 5 6 7 | |
We provided a 1-1024 range to find every open TCP connection in that port range (inclusive.)
The lsof command is super powerful. Learn to use it to your advantage so that you can quickly check your system networking status and debug problems.
Other tools#
I've included a table below that contains a lot of other tools you'll come across. We'll eventually cover these tools, but for now you can find links to their manual pages and you can also just put them to one side for the time being. We'll revisit these concepts another time.
| Topic | Resource Location | Link |
|---|---|---|
ping | linux.die.net | man ping |
ifconfig | linux.die.net | man ifconfig |
iptables | linux.die.net | man iptables |
ufw | manpages.ubuntu.com | man uwf 8 |
netstat | linux.die.net | man netstat |
traceroute | linux.die.net | man traceroute |
nslookup | linux.die.net | man nslookup |
dig | linux.die.net | man dig |
tcpdump | linux.die.net | man tcpdump |
nmap | linux.die.net | man nmap |
Next#
Let's now look at iostat so that we can determine what's happening to our storage devices.